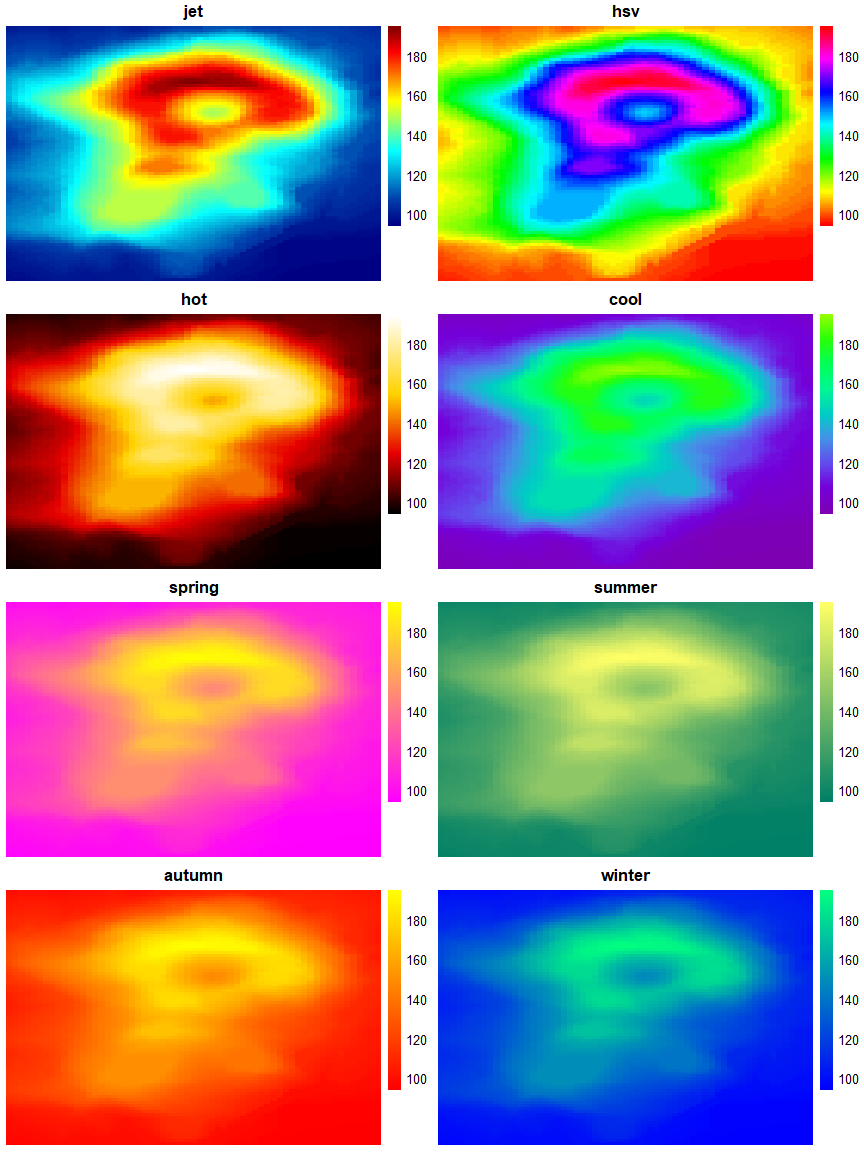
library(grid) library(gridExtra) library(pheatmap) library(ggplot2) library(colormap) items=names(colormaps) plot_list=list() for(a in items[1:8]){ x= pheatmap(volcano, cluster_rows =F, cluster_cols =F, main = a, height =3, width =3, border_color =NA, color = colormap_pal(colormap = colormaps[[a]])(100),silent =T) plot_list[[a]]= x[[4]]##to save each plot into a list. note the [[4]] }