Learn-igraph-Basic
Learn-igraph系列是对Statistical Analysis of Network Data with R一书的学习笔记,介绍如何使用R进行网络数据分析,网络数据的处理主要是基于igraph包,可视化用的是ggnet
0. 基本概念
一些需要知道的基本概念;
Network;
Graph;
Order of a graph;
Size of a graph;
directed graph;
undirected graph;
subgraph;
1. 创建igraph class
1.1 无向图
igraph包处理网络图的数据结构为igraph class, 最基础的创建方式如下:
library(igraph) |
该网络的基本信息可以通过如下方式获得:
V(g) |
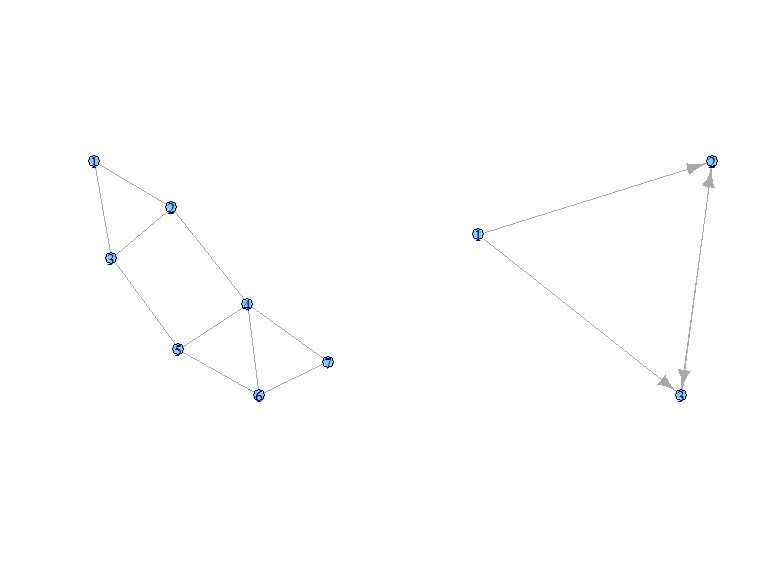
1.2 有向图
同样的方法,也可以用来创建有向图;
dg <- graph.formula(1-+2,1-+3,2++3) |
par(op) |
1.3 从邻接矩阵导入图;
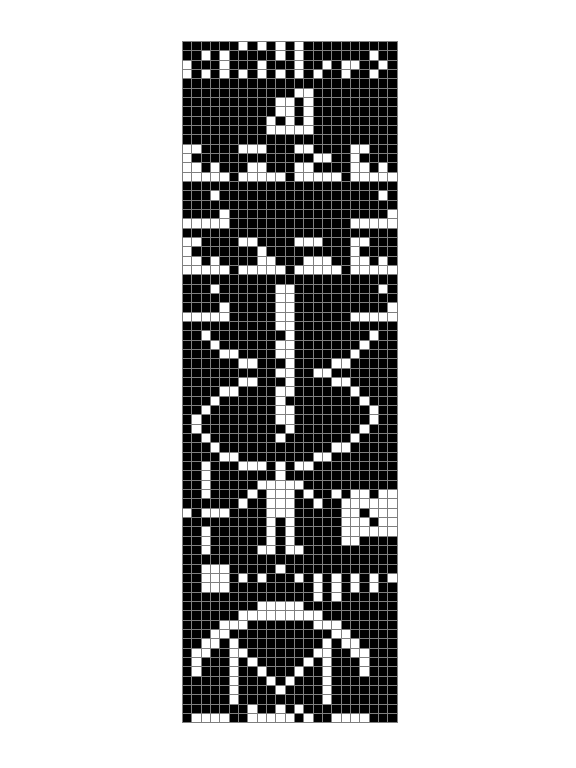
我们选择一个神奇的数据Arecibo_message[https://en.wikipedia.org/wiki/Arecibo_message], 来说明,有时候,信息所对应的矩阵,可能就是一张图片,而不是一个图。
###python command comes from |
如果直接可视化这个图,我们什么也看不出来,然而,如果我们用将原数据视为栅格数据,那么,我们能看出这个数据的内涵是很丰富的
dat_long <- reshape2::melt(mat) |
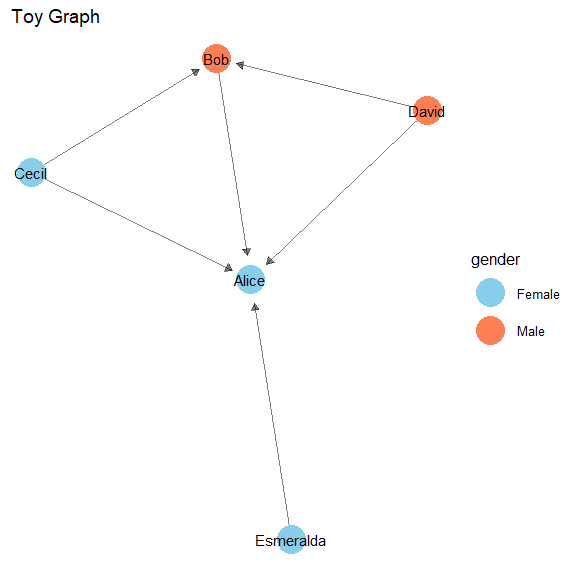
1.4 从data.frame中创建图
需要两个输入,一个是边的信息,一个是节点的信息
## A simple example with a couple of actors |
##                name age gender
## Alice         Alice  48      F
## Bob             Bob  33      M
## Cecil         Cecil  45      F
## David         David  34      M
## Esmeralda Esmeralda 21 Fas_data_frame(g, what="edges") |
## from to same.dept friendship advice
## 1 Bob Alice FALSE 4 4
## 2 Cecil Bob FALSE 5 5
## 3 Cecil Alice TRUE 5 5
## 4 David Alice FALSE 2 4
## 5 David Bob FALSE 1 2
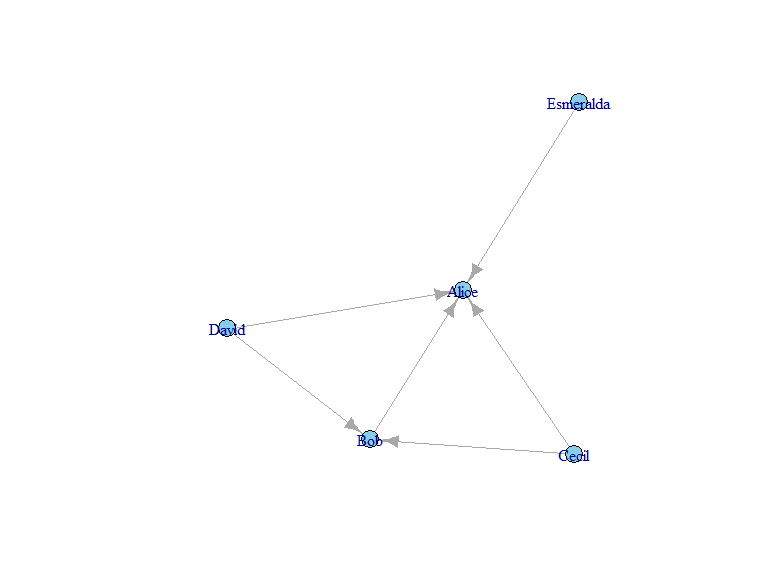
## 6 Esmeralda Alice TRUE 1 3可视化,
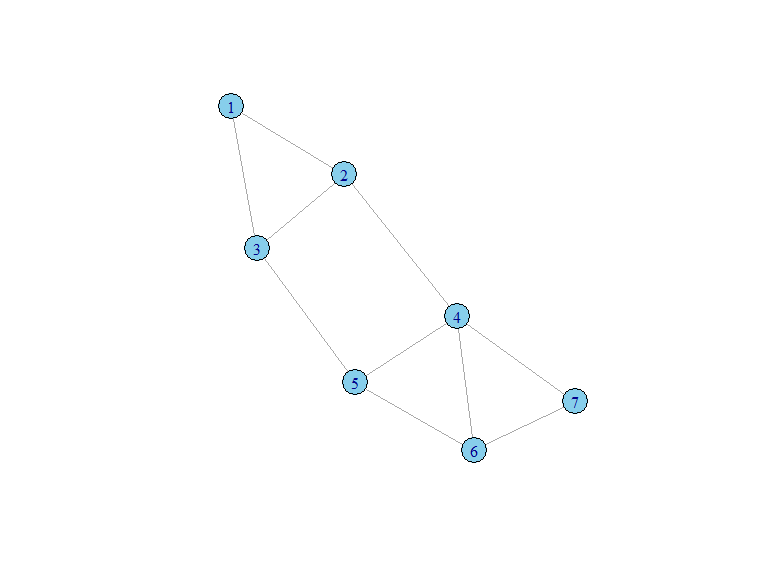
plot(g,vertex.size=10,vertex.color="skyblue") |
1.5 用预定义的函数生成
igraph里有很多带make的函数,是可以生成图的
# ls.str and lsf.str return an object of class "ls_str", basically the character vector of matching names (functions only for lsf.str), similarly to ls, with a print() method that calls str() on each object. |
## [1] "make_" "make_bipartite_graph"
## [3] "make_chordal_ring" "make_clusters"
## [5] "make_de_bruijn_graph" "make_directed_graph"
## [7] "make_ego_graph" "make_empty_graph"
## [9] "make_full_bipartite_graph" "make_full_citation_graph"
## [11] "make_full_graph" "make_graph"
## [13] "make_kautz_graph" "make_lattice"
## [15] "make_line_graph" "make_ring"
## [17] "make_star" "make_tree"
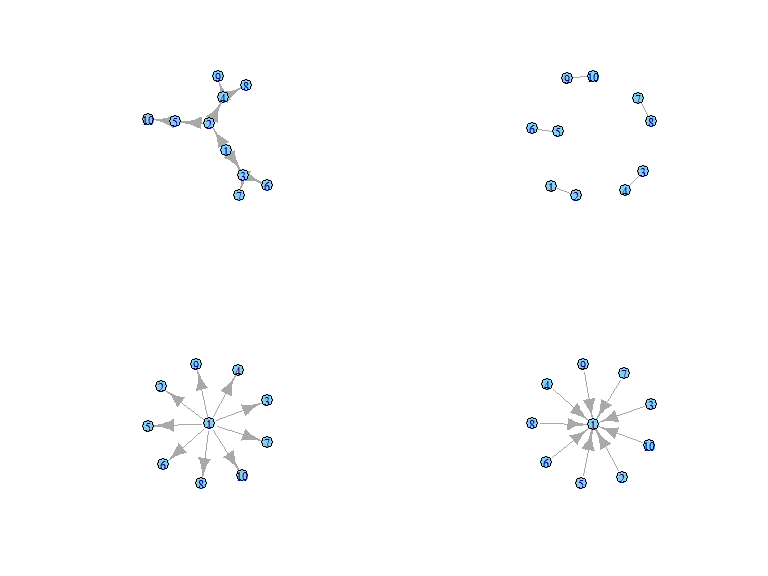
## [19] "make_undirected_graph"我们展示其中的一些图:
g1 <- make_tree(10, 2) |
par(op) |
2. 基本操作
诱导子图
g <- graph.formula(1-2,1-3,2-3,2-4,3-5,4-5,4-6,4-7,5-6,6-7) |
## IGRAPH d91ee38 UN-- 5 6 --
## + attr: name (v/c)
## + edges from d91ee38 (vertex names):
## [1] 1--2 1--3 2--3 2--4 3--5 4--5
Exclusion:
h <- g - vertices(c(6,7)) |
## IGRAPH d923ec9 UN-- 5 6 --
## + attr: name (v/c)
## + edges from d923ec9 (vertex names):
## [1] 1--2 1--3 2--3 2--4 3--5 4--5
Inclusion:
h <- h + vertices(c(6,7)) |
## IGRAPH d928f5d UN-- 7 10 --
## + attr: name (v/c)
## + edges from d928f5d (vertex names):
##  [1] 1--2 1--3 2--3 2--4 3--5 4--5 4--6 4--7 5--6 6--7
union:
h1 <- h |
## IGRAPH d92f82f UN-- 7 10 --
## + attr: name (v/c)
## + edges from d92f82f (vertex names):
##  [1] 6--7 5--6 4--7 4--6 4--5 3--5 2--4 2--3 1--3 1--2
3. 查看/添加/修改 属性
首先创建一个示例的图,
## A simple example with a couple of actors |
我们可以通过$运算符来查看,添加,修改属性
###check edge attribute |
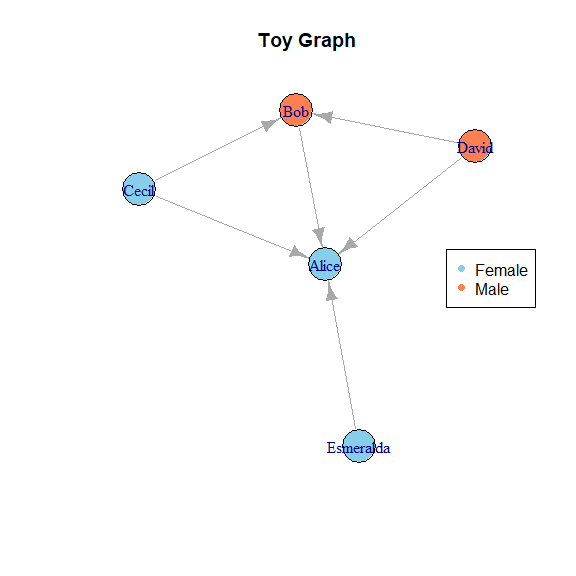
可视化如下:
## A simple example with a couple of actors |
## [1] "Female" "Male" "Female" "Male" "Female"g$name <- "Toy Graph" |
set.seed(42) |
4. 更多关于图的概念和术语
4.1 概念
下述概念不搬运书里的定义;忘记就查书。后面的章节会再用到这些概念,进行图的可视化与统计分析。
multi-graph
simple-graph: 可以用
is.simple()判定,可以用simplify()将multi-graph转换为simple-graph.neighbors
degree: The degree of a vertex v defined as the number of edges incident on v;
in-degree
out-degree
walk
trails
circuit & cylce;
reachable
graph connected
component of a graph
strong connected
weak connected
distance/geodesic distance
diameter
4.2 一些特殊的图
与第一节有重叠
complet graph
clique
regular graph
tree
forest
root
ancestor
descendant
parents, children
k-star
dirrected acyclic graph(DAG)
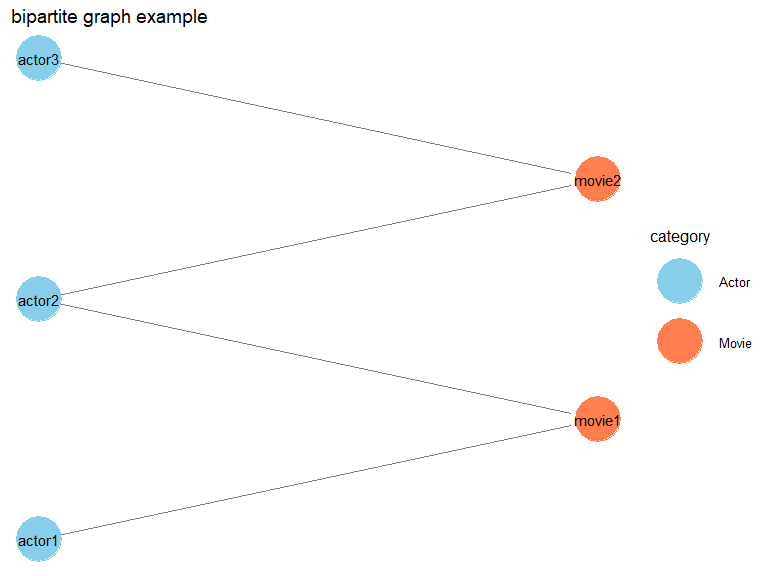
bipartite graph
g.bip <- graph.formula(actor1:actor2:actor3, |
## [1] "Actor" "Actor" "Actor" "Movie" "Movie"g <- g.bip |
##   x   y   name  type category      xend      yend
## 1 0 0.0 actor1 FALSE    Actor 0.9514929 0.2378732
## 2 0 0.5 actor2 FALSE    Actor 0.9514929 0.2621268
## 3 0 0.5 actor2 FALSE    Actor 0.9514929 0.7378732
## 4 0 1.0 actor3 FALSE    Actor 0.9514929 0.7621268
## 5 0 0.0 actor1 FALSE    Actor 0.0000000 0.0000000
## 6 0 0.5 actor2 FALSE Actor 0.0000000 0.5000000ggplot(gg.net, aes(x = x, y = y, xend = xend, yend = yend)) + |
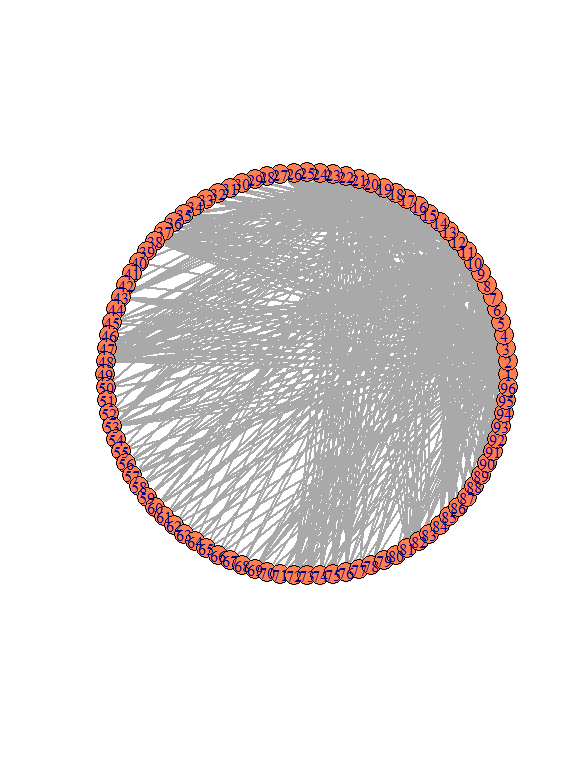
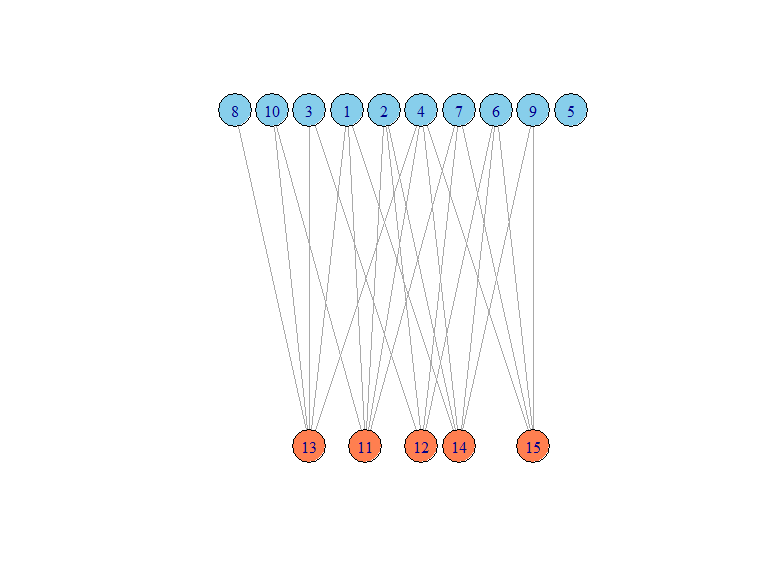
igraph自带的例子:
# Random bipartite graph |
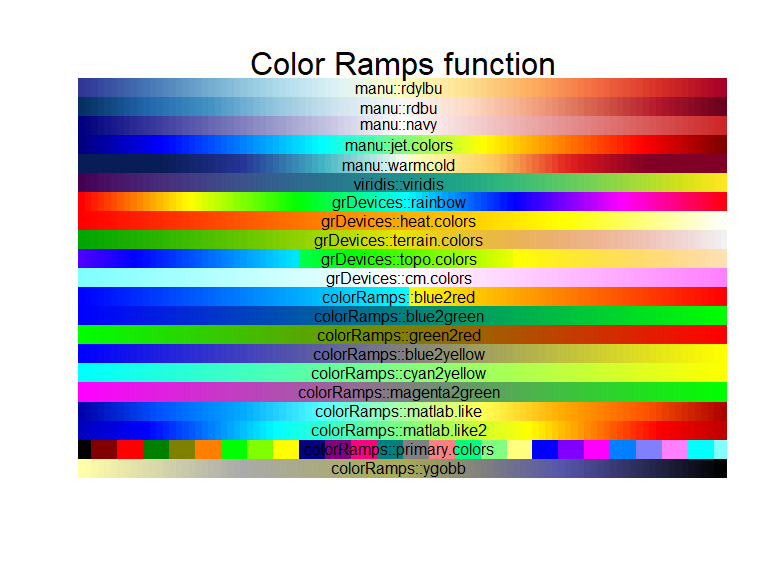
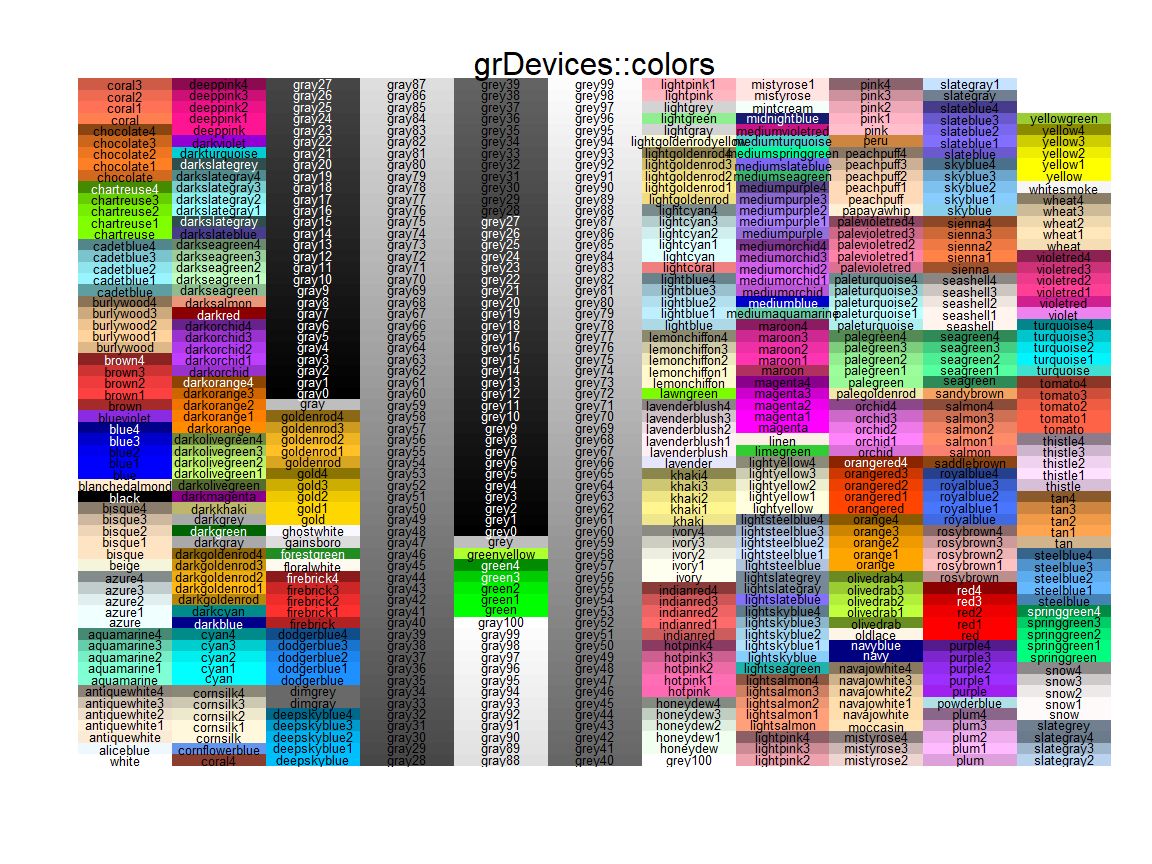
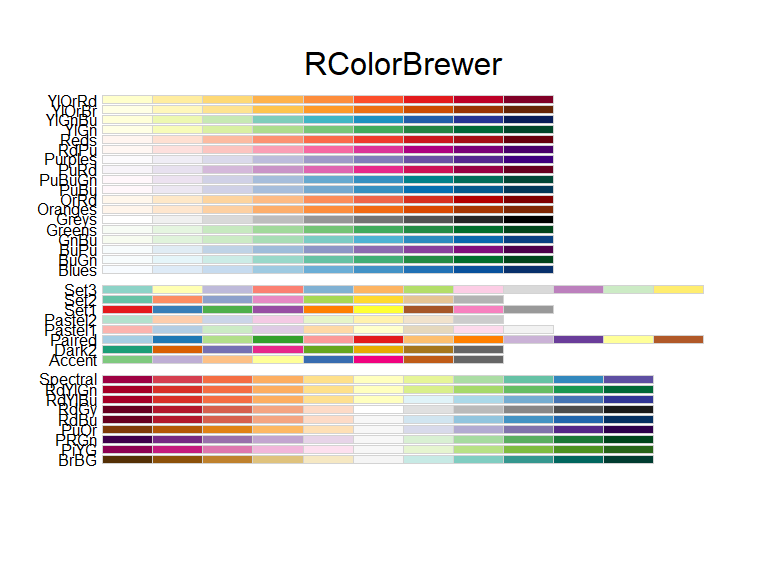
附录:R配色
基本颜色:
#### code provided by |
调色版
RColorBrewer::display.brewer.all() |
渐变色
library(RColorBrewer) |