LearnSeurat_CITE_seq
前言
CITE-seq是Rahul Satija和Peter Smibert两个组合作开发的在单细胞精度,同时测量细胞表面蛋白表达和转录组的技术。该技术原理如下:

该项技术可以用于免疫相关的单细胞测序研究中。例如, 有研究表明称:
他们在人和小鼠非小细胞肺癌中进行单细胞RNA测序,鉴定了一群DC,并将其命名为“富含免疫调节分子的成熟DC”(mregDC),这是由于它们共表达了免疫调节基因(Cd274,Pdcd1lg2和Cd200)和成熟基因(Cd40,Ccr7和Il12b)。
这段中文报道来自小柯机器人
Rahul Satija组开发的软件Seurat有一个教程,可以分析CITE-seq数据。本文基于该教程对该类型数据的分析进行说明。
数据载入
首先我们需要获取数据,该数据集取样为8617个脐带血单核细胞,包含了表达谱数据和11个抗体来源标签数据(antibody-derived tags ,ADT)。
library(Seurat) |
## 10 x 10 sparse Matrix of class "dgCMatrix"
##
## A1BG     . . . . . . . . . .
## A1BG-AS1 . . . . . . . . . .
## A1CF     . . . . . . . . . .
## A2M      . . . . . . . . . .
## A2M-AS1  . . . . . . . 1 . .
## A2ML1    . . . . . . . . . .
## A4GALT   . . . . . . . . . .
## A4GNT    . . . . . . . . . .
## AAAS     . . . . . . . . . 1
## AACS     . . . . . . . . . .
### ADT count matrix |
## 10 x 10 sparse Matrix of class "dgCMatrix"
##
## CD3     60   52  89  55  63  82  53  42 103  56
## CD4     72   49 112  66  80  78  63  59 122  70
## CD8     76   59  61  56  94  57  61  55  64  80
## CD45RA 575 3943 682 378 644 479 487 472 540 535
## CD56    64   68  87  58 104  44  64  48 136  91
## CD16   161  107 117  82 168  92  77  99 235 131
## CD11c   77   65  65  44  92  63  70  75 106  69
## CD14   206  129 169 136 164 122 112 111 206 204
## CD19    70  665  79  49  81  44  60  58  61 107
## CD34   179   79  78  83 152 103  79  86 144 193
### show default assay |
## [1] "RNA"根据基因表达进行聚类
注意在默认参数的情况下,下述操作时对Default Assay进行的
# standard log-normalization |
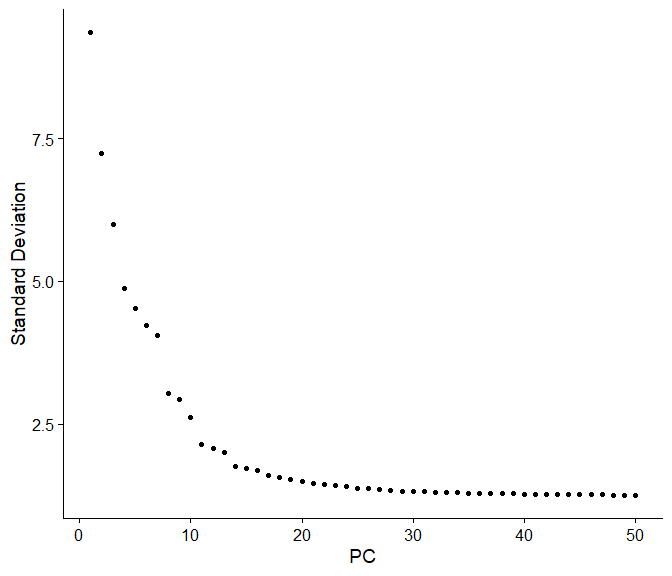
下面的图是根据标准差来选择PCs
ElbowPlot(cbmc, ndims = 50) |
聚类和t-SNE降维
cbmc <- FindNeighbors(cbmc, dims = 1:25) |
## Modularity Optimizer version 1.3.0 by Ludo Waltman and Nees Jan van Eck
##
## Number of nodes: 8617
## Number of edges: 347548
##
## Running Louvain algorithm...
## Maximum modularity in 10 random starts: 0.8592
## Number of communities: 19
## Elapsed time: 3 seconds
cbmc <- RunTSNE(cbmc, dims = 1:25, method = "FIt-SNE") |
我们看看聚类结果:
DimPlot(cbmc, label = TRUE) + NoLegend() |
## Warning: Using `as.character()` on a quosure is deprecated as of rlang 0.3.0.
## Please use `as_label()` or `as_name()` instead.
## This warning is displayed once per session.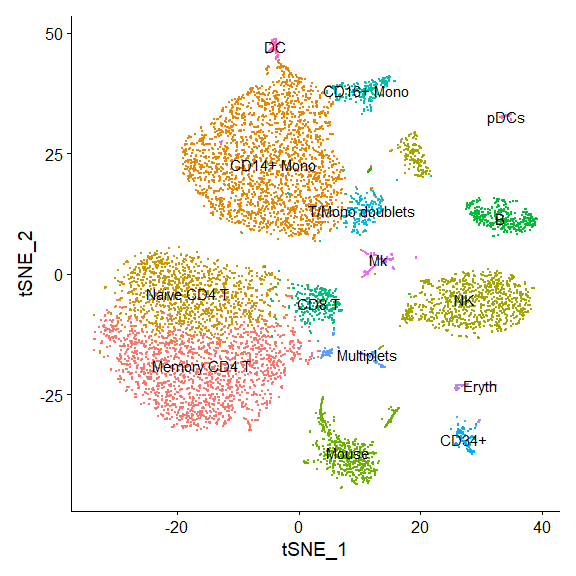
蛋白表达数据处理
Seurat3的assay实现多个组学或者模态的数据的存储和获取。 代码里的注释来自Seurat官网。
# Now we can repeat the preprocessing (normalization and scaling) steps that we typically run |
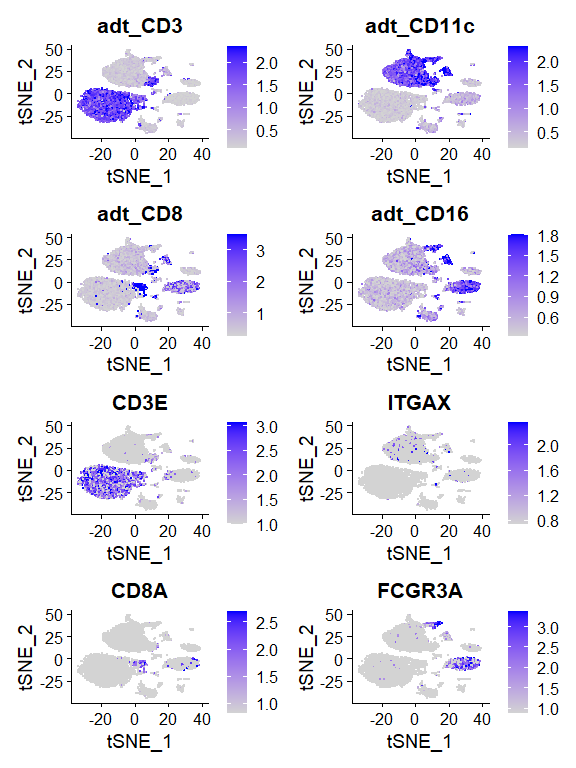
在RNA表达谱的降维Embedding中同时展示展示蛋白表达水平和基因表达水平:
散点图:横纵轴为降维的坐标:
# in this plot, protein (ADT) levels are on top, and RNA levels are on the bottom |
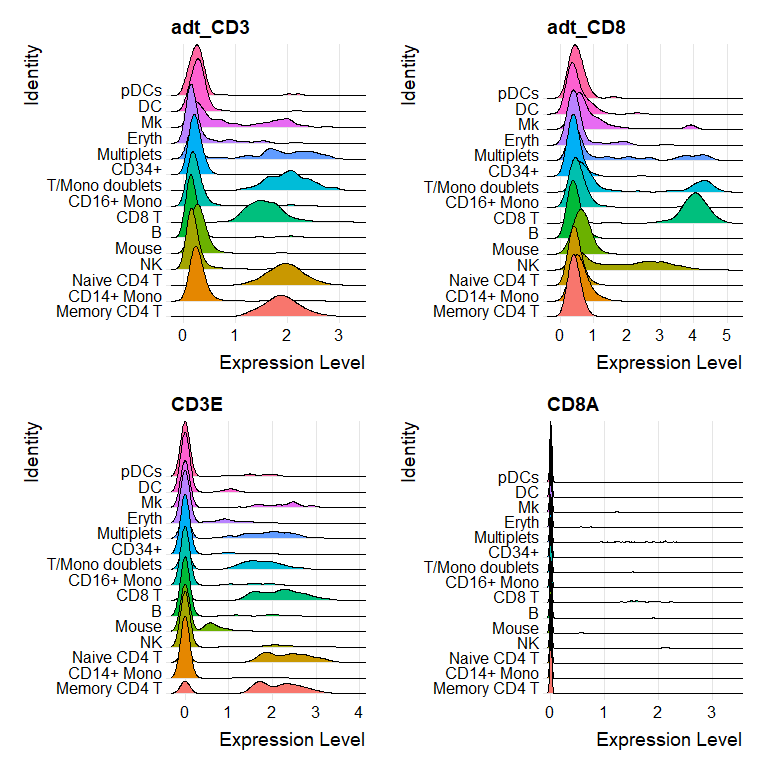
Ridge Plot:
RidgePlot(cbmc, features = c("adt_CD3", "adt_CD8", "CD3E","CD8A"),ncol = 2) |
散点图:横纵轴为表达量;这个类似于FACS
# Draw ADT scatter plots (like biaxial plots for FACS). Note that you can even 'gate' cells if |
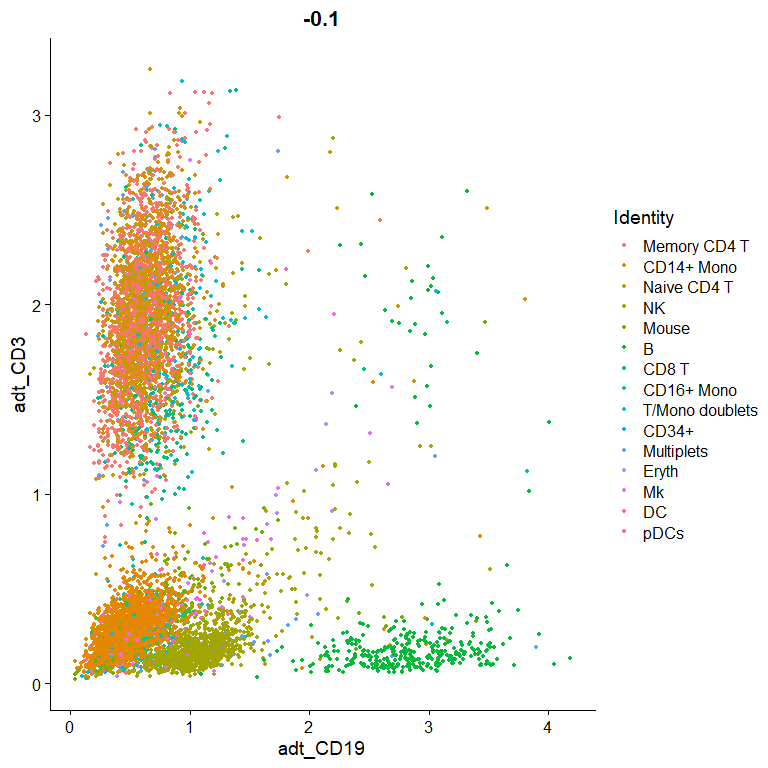
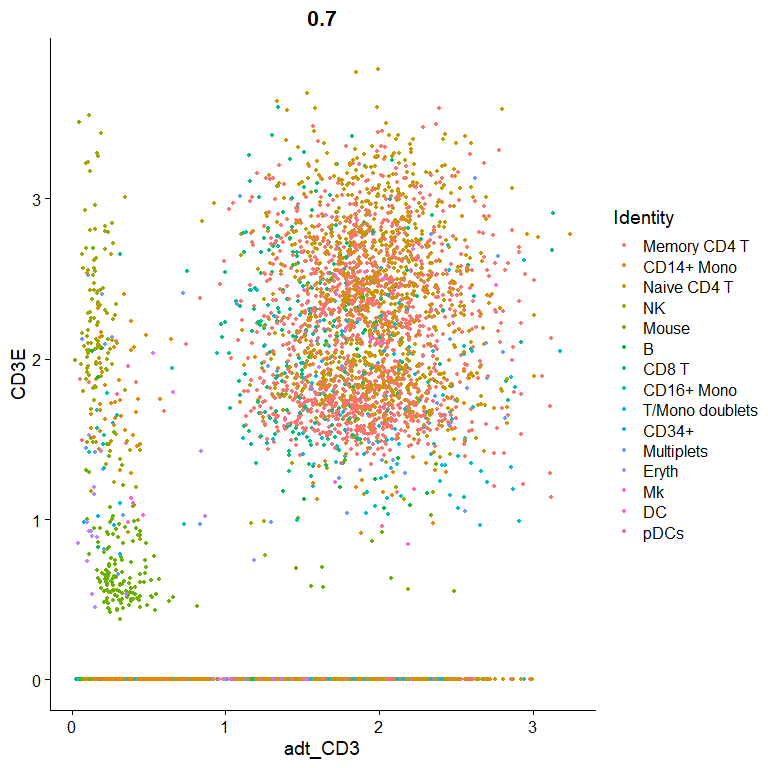
我们也可以看看蛋白表达和基因表达的关系:
# view relationship between protein and RNA |
我们可以看看T细胞:
# Let's plot CD4 vs CD8 levels in T cells |
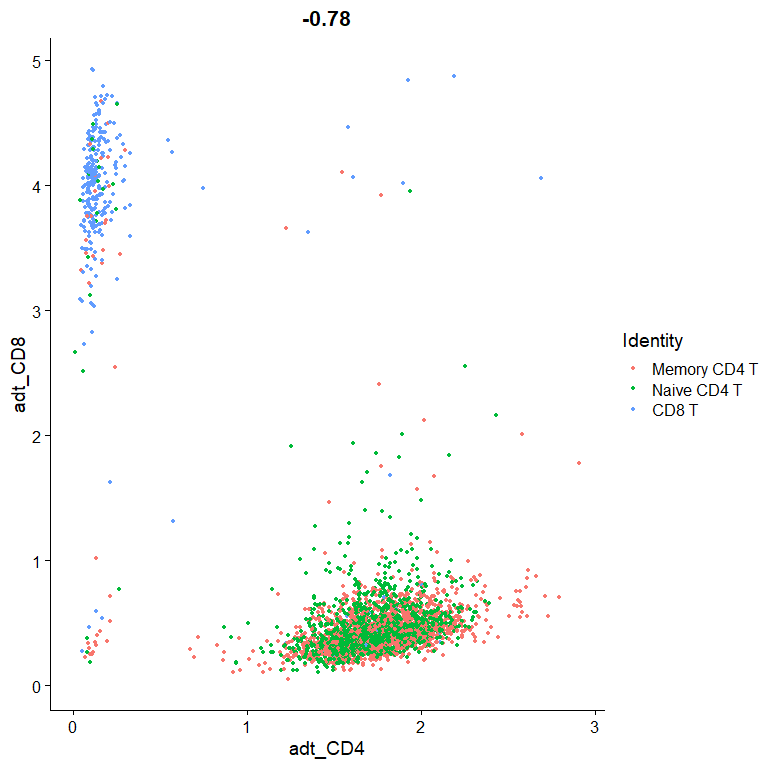
选没有标准化的原始数据我们看看,坐标轴的间距太大,会有misleading
# # Let's look at the raw (non-normalized) ADT counts. You can see the values are quite high, |
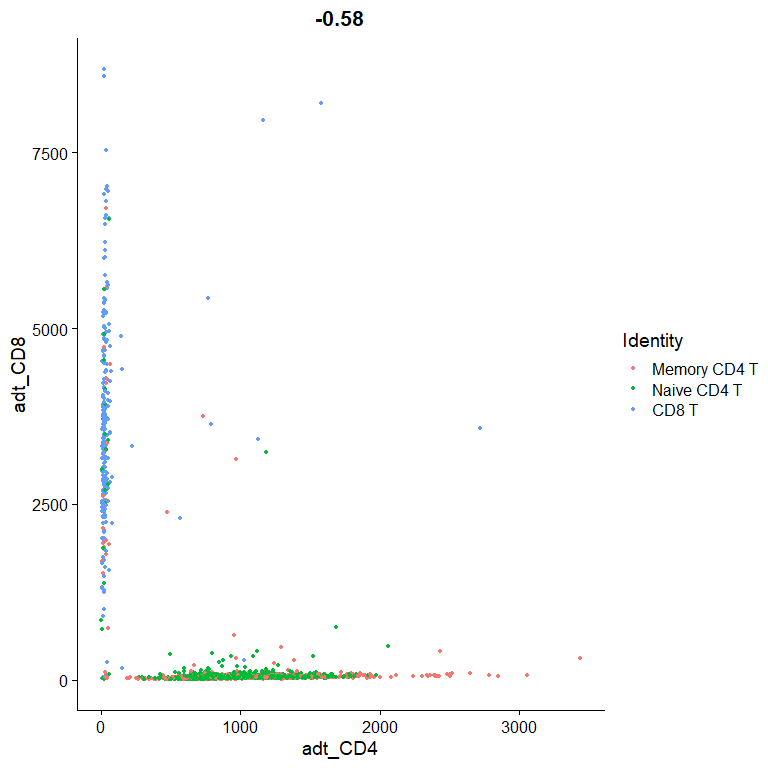
这里还是可以观察到dropouts现象的,据原作者说: > If you look a bit more closely, you’ll see that our CD8 T cell cluster is enriched for CD8 T cells, but still contains many CD4+ CD8- T cells. This is because Naive CD4 and CD8 T cells are quite similar transcriptomically, and the RNA dropout levels for CD4 and CD8 are quite high. This demonstrates the challenge of defining subtle immune cell differences from scRNA-seq data alone.
画热图,Seurat3 加了 downsample的功能。
# Downsample the clusters to a maximum of 300 cells each (makes the heatmap easier to see for small clusters) |
我们可以看看Seurat热图的默认配色(三个冒号可以看更为底层的函数), 个人觉得并不好看。
# using code from RColorBrewer to demo the palette |
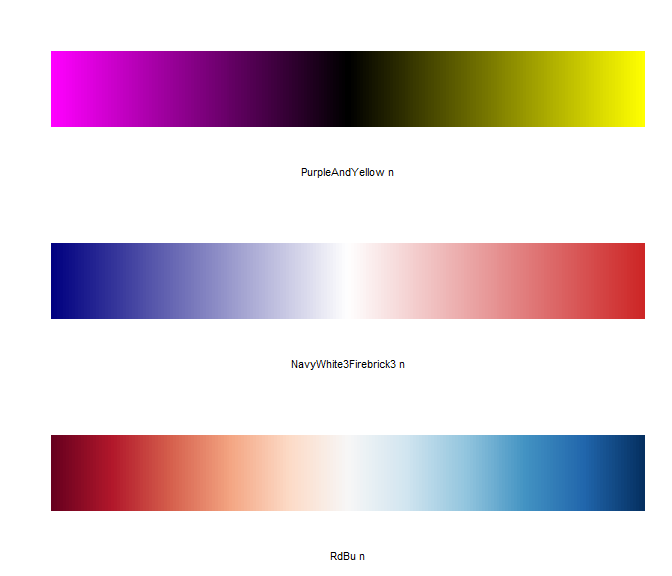
把默认配色换掉,见
mypal <- rev(colorRampPalette(RColorBrewer::brewer.pal(11,"RdBu"))(256)) |
## Scale for 'fill' is already present. Adding another scale for 'fill', which
## will replace the existing scale.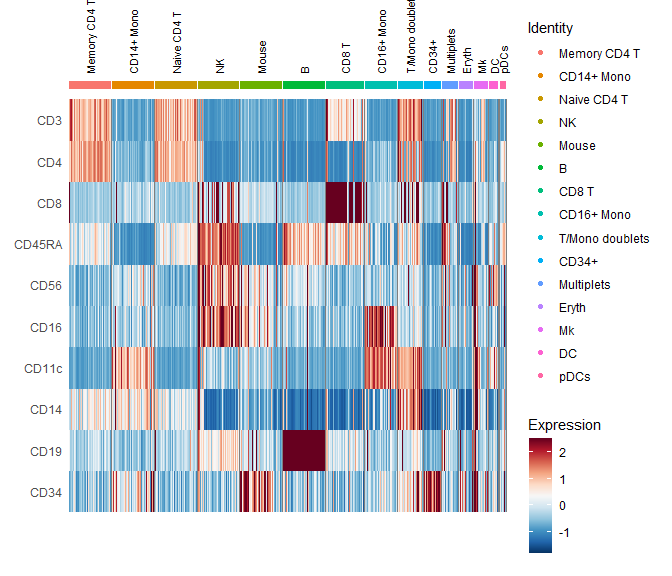
去除细胞杂质,
# You can see that our unknown cells co-express both myeloid and lymphoid markers (true at the |
直接根据蛋白质表达水平进行聚类
# Because we're going to be working with the ADT data extensively, we're going to switch the |
再来看PCA(其实这里算是degenrate到线性组合了)
DimPlot(cbmc, reduction = "pca_adt") |
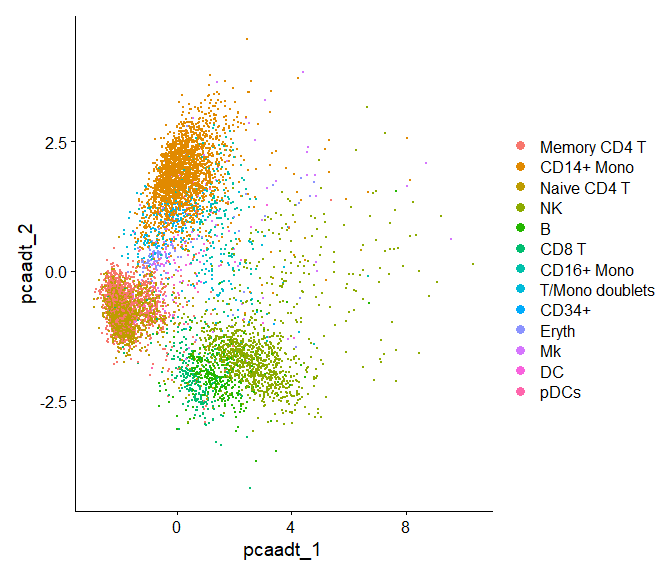
# Since we only have 10 markers, instead of doing PCA, we'll just use a standard euclidean |
## Modularity Optimizer version 1.3.0 by Ludo Waltman and Nees Jan van Eck
##
## Number of nodes: 7895
## Number of edges: 258146
##
## Running Louvain algorithm...
## Maximum modularity in 10 random starts: 0.9491
## Number of communities: 11
## Elapsed time: 2 seconds
# We can compare the RNA and protein clustering, and use this to annotate the protein clustering |
##
##      Memory CD4 T CD14+ Mono Naive CD4 T   NK    B CD8 T CD16+ Mono
##   0          1754          0        1217   29    0    27          0
##   1             0       2189           0    4    0     0         30
##   2             3          0           2  890    3     1          0
##   3             0          4           0    2  319     0          2
##   4            24          0          18    4    1   243          0
##   5             1         27           4  157    2     2         10
##   6             4          5           0    1    0     0          0
##   7             4         59           4    0    0     0          9
##   8             0          9           0    2    0     0        179
##   9             0          0           1    0    0     0          0
##   10            1          0           2    0   25     0          0
##
##      T/Mono doublets CD34+ Eryth   Mk   DC pDCs
##   0                5     2     4   24    1    2
##   1                1     1     5   25   55    0
##   2                0     1     3    7    2    1
##   3                0     2     2    3    0    0
##   4                0     0     1    2    0    0
##   5               56     0     9   16    6    2
##   6                1   113    81   16    5    0
##   7              117     0     0    2    0    1
##   8                0     0     0    1    0    0
##   9                0     0     0    0    1   43
##   10               2     0     0    0    0    0
下面这个embeding 还是根据ADT来的(不过只要marker连续,只有10个也没有关系?)
new.cluster.ids <- c("CD4 T", "CD14+ Mono", "NK", "B", "CD8 T", "NK", "CD34+", "T/Mono doublets", |
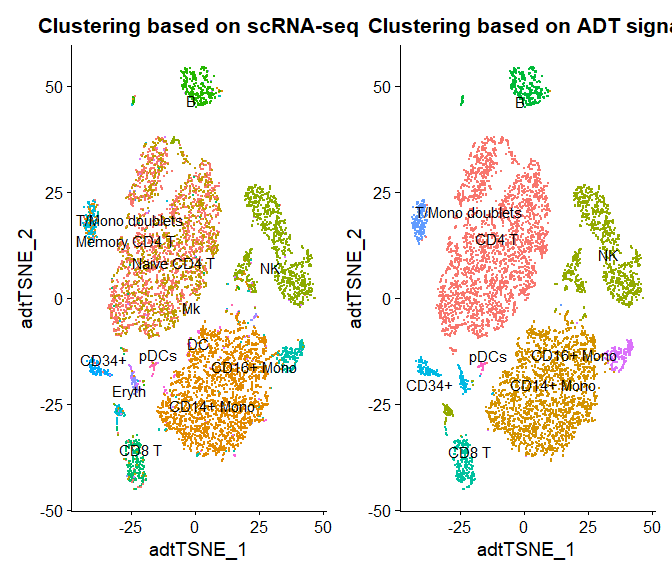 对于该结果,作者是这么解释的:
The ADT-based clustering yields similar results, but with a few differences + Clustering is improved for CD4/CD8 T cell populations, based on the robust ADT data for + CD4, CD8, CD14, and CD45RA + However, some clusters for which the ADT data does not contain good distinguishing protein markers (i.e. Mk/Ery/DC) lose separation You can verify this using FindMarkers at the RNA level, as well
更多
pbmc 10k的细胞也提供了CITE-seq的多模态数据,具体细节,请看Seurat官方教程。